The only alpha that compounds
Professional investors lose more on the sell side than they pay in fees, and the same three leaks show up again and again: exits, sizing and follow-through. Measuring them used to cost fund-level fees. Here is what happened when we ran the method on one of our own accounts.
Professional portfolio managers are good at buying and measurably bad at selling.
A paper in the Journal of Finance tracked the daily holdings and trades of 783 institutional portfolios averaging $573 million each, covering 4.4 million high-stakes trades between 2000 and 2016. On the buy side, those managers showed real skill, beating the assets already in their portfolios by over 100 basis points a year per dollar of purchase volume.
On the sell side, the same managers gave up 80 basis points a year against a strategy that picks which position to sell at random.
Buying: +100 bps a year. Selling: -80 bps a year. Active funds charge 20 to 50 bps a year, so the selling leak is bigger than the fee.
The authors interviewed the managers and put the gap down to attention rather than ability. Managers spend their time on the next idea and treat selling as a way to raise cash for it. Sell decisions taken on earnings announcement days, when the position already has their attention, beat other days by more than 150 basis points a year.
Selling is one leak of three. The other two open up after the buy.
Sizing. Alpha Theory has spent twenty years arguing that funds rarely write down upside, downside and conviction for each position, and that sizes drift away from conviction when nobody writes them down.
Follow-through. Essentia Analytics publishes client cases: one long-short manager improved by more than 500 basis points a year, mostly from better trimming, and one manager inside a $300 billion firm found 68 basis points by changing how positions were handled after purchase.
None of the three sits in idea generation, and all three repeat, which is what makes them worth measuring.
Measuring this is called decision attribution, and it has two decades of institutional history. What it has never had is a delivery model that reaches anyone outside a large fund. Below is why the method works, why almost nobody runs it, and what changes when the cost of running it drops. The last section is a demonstration on the personal account of one of our team, the smallest book we had to test it against.
Why this edge does not decay
Most edges decay. Information spreads, and analytical edges erode as the tools improve, which the current wave of AI research tools, Finn included, is doing quickly. Whatever a good analyst produced for you last year, a subscription produces for everyone this year. The quality of your own decisions sits outside that race, and a leak you find and fix in your own process stays fixed.
The industry already prices this. Morningstar's Mind the Gap study puts investor returns about 1.2 percentage points a year below the funds those investors hold, mostly through the timing and size of their own transactions, which compounds to roughly 15% of total return over a decade. Academics dispute how much of that gap is genuinely avoidable, and the number is an estimate rather than a law.
Vanguard comes at it from the other direction. Its Advisor's Alpha framework values behavioral coaching, meaning an advisor talking a client out of their worst instincts, at about 150 basis points a year. That is the largest single component of what Vanguard thinks advisors are worth, and today it is delivered by expensive humans.
The method works at fund level
The oldest version of this is the decision journal. Asked what one thing an investor could do to improve their performance, Daniel Kahneman said to buy a cheap notebook and start recording decisions: what you decided, why, what you expected, and what alternatives you weighed, written at the time and read again later. The value is an honest record of what you were thinking before hindsight rewrites it. Michael Mauboussin has recommended the same for years, and Michael Ervolini, who ran Cabot Research to analyse fund managers' decision skill, built a book around the observation that conventional tools report outcomes and say almost nothing about the decisions behind them.
At institutional level this became a product category. Essentia Analytics has sold decision attribution to professional portfolio managers since 2013, and its methodology is published in the peer-reviewed Journal of Investing. It scores a manager across seven decision types:
Stock picking
Entry timing
Sizing
Scaling in
Size adjusting
Scaling out
Exit timing
Four of the seven happen after the idea, which is where the leaks sit. Essentia pairs the analytics with nudges and a dedicated former fund manager who coaches you through your own patterns, and Morningstar has adopted its decision-skill score into Morningstar Direct.
None of these firms has any connection to Finn, and nothing here is their endorsement. We cite them because they are the proof that the method clears institutional scrutiny, allocator money and peer review. What has held it back is delivery: data integration projects, human coaches, fund-level fees. The peer-reviewed version of Essentia's benchmark covered ninety active equity managers over three years, which after a decade of validation says more about the delivery model than about demand.
Why almost nobody does it
Below fund level it falls apart, for reasons the trading-journal industry knows well. Their own marketing states the rule: if logging a trade takes more than about thirty seconds, users eventually stop. Day-trading journals survived by importing automatically from brokers, and because their users generate material daily.
A long-term investor has neither. You make a handful of real decisions a year, so the habit never forms, and the entries that would matter most get written least: the panicked exit, the conviction add, the freeze in a drawdown. What people actually produce is hundred-page documents nobody can search, reasoning scattered across spreadsheets and email, and systems rebuilt every January and abandoned by March. Professionals are not much better. A survey by Bipsync, a research-management vendor, found around three quarters of funds still running their research process on shared drives, email and consumer note apps.
There is a second problem behind the first: a diary cannot score itself. Scoring a decision needs the alternative you were weighing at the time, the prices since, and return maths that handles money moving in and out. A notebook holds the reasoning but cannot mark it to market.
Sleep diaries are the closest precedent. They existed for decades and almost nobody kept one, until a device did the logging and sleep tracking became a mass-market habit. People want the self-knowledge and nobody wants the bookkeeping, so any version of decision attribution that depends on the investor writing things down will fail the way the earlier ones did.
What changes when the record keeps itself
If your research happens in conversation with an analyst that also sees your book, the record builds itself while the analyst does the job you hired it for.
The pieces a decision journal needs arrive on their own.
What the record needs | The old way | How it happens now |
|---|---|---|
Your reasoning at the time | Written up later, if at all | You said it while researching |
The alternatives you weighed | Remembered, badly | Weighed with the analyst, on the record |
The trades | Typed in by hand | Imported from broker statements |
Scoring | Impossible in a notebook | Code pulls the prices and computes the paths |
Enforcement | Willpower | Software watches the level you set |
This matters more at fund level. A professional book makes twenty to fifty times the decisions of a personal account, so it loses twenty to fifty times as much when logging is work. Automatic capture scales with decision volume, while manual journaling scales with spare attention, which a working PM does not have.
Running the method end to end
The open question is whether this runs without the integration project that kept it inside large funds, so I pointed it at the simplest book available, my own, and timed it.
2 statement exports. 10 minutes of setup. 19 months rebuilt in an afternoon. The portfolio month by month, position by position, and every decision scored against the alternative I was weighing at the time.
Reconstruction is where this kind of exercise usually goes wrong. Neither statement records what I held on the last day of 2024, so the opening book was backed out from settlement amounts divided by the price on each trade date. Every implied quantity resolved to a whole number of shares at an execution price within 0.1% of that day's close, which would not happen if a fund had been misidentified.
Both cash balances tied to the statements to the cent. One securities total came out 0.28% apart, because the workbook prices everything at exchange closes while my broker uses its own snapshots. One holding predates the period with no transaction in either statement, so it is carried forward on trust rather than derived.
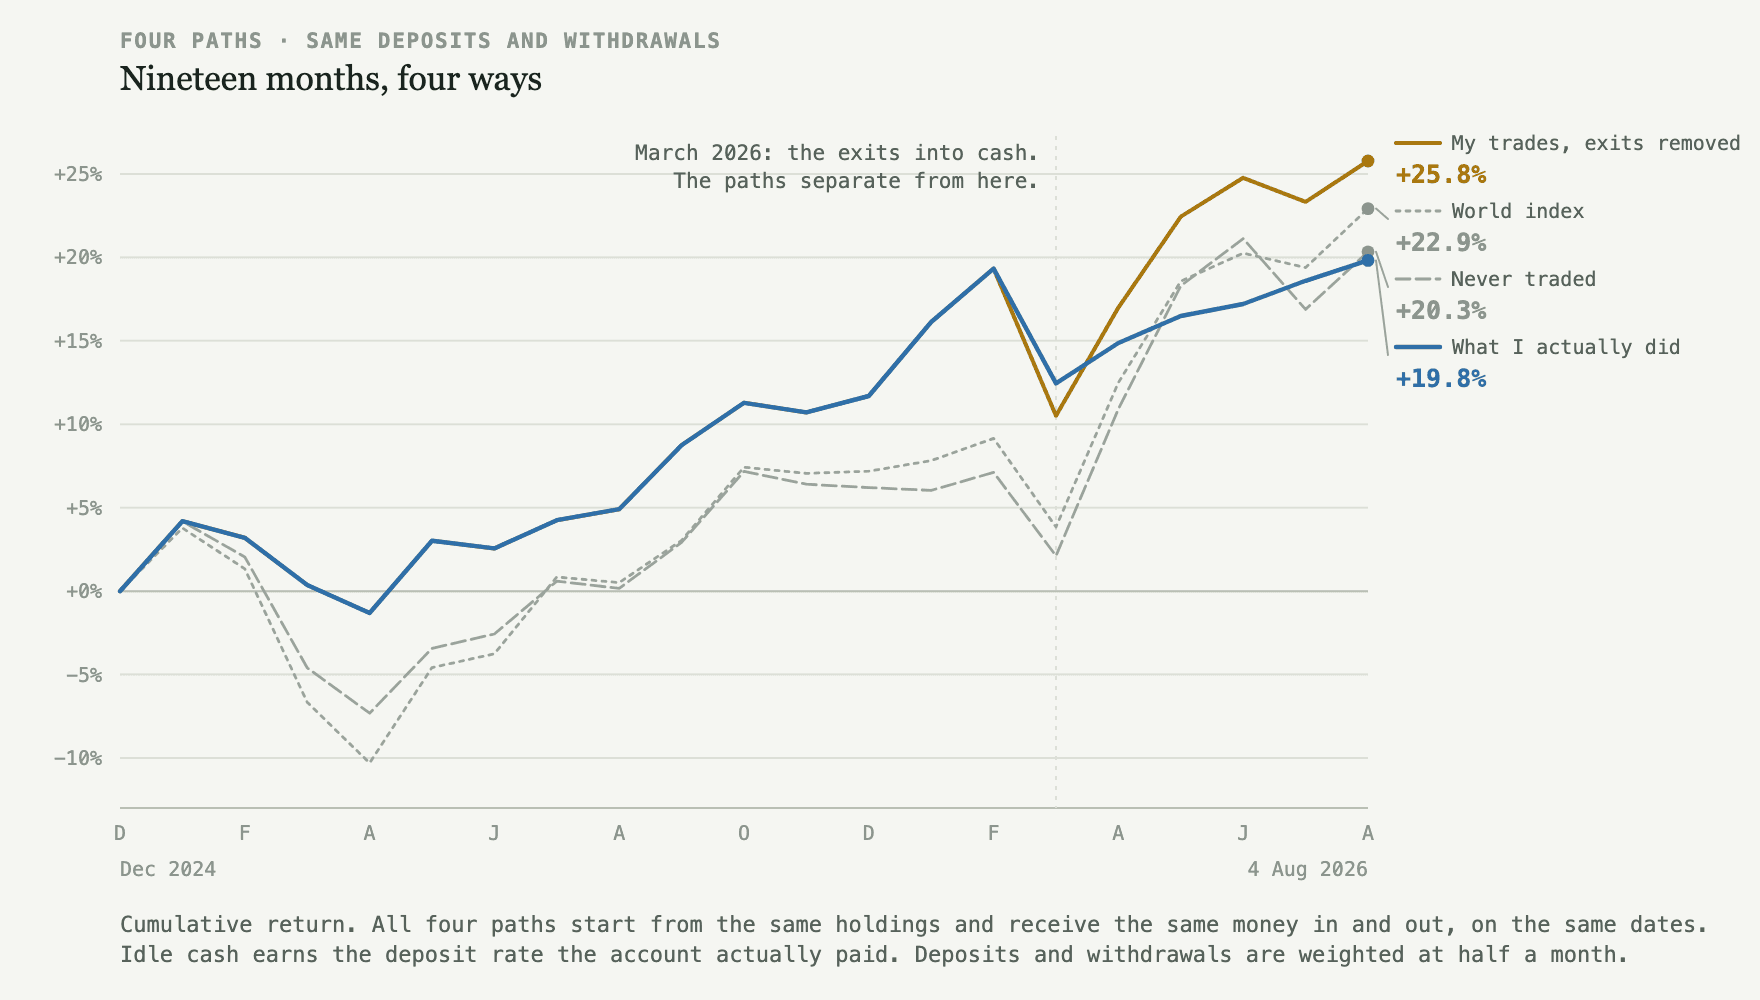
The spine of the review is four versions of the same nineteen months. All four start from my actual holdings and receive exactly the money I deposited and withdrew, on the same dates, and they differ only in what was done in between.
Path | Return over the nineteen months |
|---|---|
What I actually did | +19.8% |
Never traded at all | +20.3% |
Sold everything, bought the world index | +22.9% |
My own trades, minus two exits into cash | +25.8% |
Held rather than unwound, my own trades would have beaten every passive alternative on the list, including the global index, so the ideas were sound. The account earned the first row. The six percentage points between the first row and the last come from two decisions to sell holdings and leave the proceeds in a deposit account.
That gap is worth 5.3% of the portfolio. Priced the other way, each exit against what that holding alone would be worth today, the same two decisions cost 6.7%, more than three times what every good call earned combined. The first number reruns the whole book, the second prices each exit on its own, and I am quoting both because picking whichever number suits the sentence is the habit this exercise is meant to catch.
The February 2025 rotation shows the idea side working. I moved the core of the portfolio out of American funds and into European ones, weeks before that became the consensus trade. Left alone, the new book would have returned 27.7% against 23.4% for the American basket I sold. As I actually managed it, the new book returned 20.7%, less than the thing I sold. The selling that came afterwards turned a good call into a slightly bad one.
The review also added a footnote I would not have written myself. The American funds I sold did fine too, up 26.8% and 39.3% in euro, so I picked the better horse in a race both horses ran well, and any story about escaping an expensive market is unsupported by my own data.
Leak one: what happens after the sell
Two of my exits, the same action six months apart, were graded in opposite directions.
In August 2025 I sold a software position and moved the money into a pharmaceutical name. The software stock has fallen 51.9% since and the replacement is roughly flat, so that swap preserved more than my two losing purchases of 2026 have lost together. The same exit suggests I do not suffer much from loss aversion, since I sell losers cleanly, which the literature says is uncommon.
In November 2025 I sold an index tracker and the money went nowhere. The fund is up 14.3% since and the cash earned under one percent a year. What separates this exit from the good one is whether the proceeds had somewhere to go. Measured against the money in it, that exit has cost 16.3%, and the larger March exits 13.3%. Three of my five sell decisions ended in a deposit account, and two of those are still there.
Leak two: sizing against conviction
My best idea of the period was the European defence entry. It returned 34.3%, and it was funded at 3.7% of the portfolio, so it added about 1.1% to the whole book. My own written plan puts the active sleeve at roughly 15%.
Funded to my own plan, that one idea would have added 5.7% instead of 1.1%.
My conviction and my position sizes point in opposite directions: the best ideas got the smallest cheques. The explanation the review offered is that a high-conviction idea feels risky because you have a view on it, while an index fund feels safe because you do not.
Leak three: follow-through
Over eight days in July I asked Finn four times how to deploy the same pool of idle cash, got four reports, and allocated nothing. The review's conclusion was that for allocation decisions my research had become a substitute for deciding. I have not seen this one in the institutional literature, and it is the finding most likely to generalise, because any tool that makes analysis cheaper also makes putting the decision off cheaper.
Enforcement failed alongside it. I set a price floor on a position and wrote it down, and in March that position fell 37% in a month and closed below the floor without anything happening. It recovered, which flatters the outcome and settles nothing about the process.
These are small versions of the same three patterns, in a book far too small to matter. What the exercise establishes is that the pipeline ran off two statement exports in an afternoon.
The findings did not end as prose. The review's five open questions became tracked items, each with a condition that closes it, and three process rules it proposed are waiting for my yes or no. A fourth is already in place, and it is the only one that binds Finn rather than me: a second report request on the same open decision now comes with a decide-by date, which I set.
Where this could be wrong
Every counterfactual above is marked at today's prices, so hindsight is doing real work. The March exits happened during an oil shock, with Brent touching $104 and Hormuz shipping traffic down 90 to 95%, so selling oil-exposed assets was a defensible risk decision, and a review written six weeks later would have graded it well. The problem is the nineteen weeks after the risk passed, when a decision made for a specific reason outlived the reason and nobody decided to keep it.
Risk-adjusted, the picture narrows, because holding a large cash balance lowers volatility and some of that gap is the price of safety. That would be a fair defence if safety were my stated objective. It is not. My own written framework calls for a small operational buffer and long-term growth, and that is the standard I would rather be measured against than an index or another manager.
What the record becomes
In month one this is a research analyst that happens to know your book. By month six it holds your theses with their version history, your rules with their enforcement record, and your decisions scored in both directions, the saves alongside the costs. Somewhere in year two it can start answering whether you are getting better, in your own basis points, against your own history.
That accumulation is the point of decision attribution. The fund-level version proved the method and priced it out of reach, and doing the research beside an analyst that keeps the record lets the same method accumulate without anyone maintaining it.
Attribution compounds fastest where decision volume is highest, which describes a fund rather than a personal account. My nineteen months produced a handful of scoreable decisions, where a working book produces that many in a fortnight, with the same three leaks and far more money moving through them.
The decisions above, including the bad ones, were all mine. This is measurement, not advice.
Sources
Klakow Akepanidtaworn, Rick Di Mascio, Alex Imas and Lawrence Schmidt, "Selling Fast and Buying Slow: Heuristics and Trading Performance of Institutional Investors", Journal of Finance 78(6), 2023, pp. 3055–3098; also NBER working paper 29076. 783 institutional portfolios averaging $573 million, 4.4 million high-stakes trades between 2000 and 2016, using Inalytics data. Buys beat existing holdings by over 100 basis points a year per dollar of purchase volume, sells give up 80 basis points a year against a factor-neutral random-selling strategy, and selling on earnings announcement days outperforms other days by more than 150 basis points a year.
Morningstar, Mind the Gap, for the 1.2 percentage point gap, and Fulkerson, Jordan, Riley and Yan, "Bad Timing Does Not Cost Investors 15% of Their Funds' Returns", forthcoming in the Financial Analysts Journal, for the counter-argument that the avoidable portion is far smaller.
Vanguard, Advisor's Alpha, for the behavioral coaching figure.
Essentia Analytics, the Behavioral Alpha Benchmark, its methodology paper in the peer-reviewed Journal of Investing, the Morningstar Direct alliance, and the 68 basis point and trimming cases.
Alpha Theory on position sizing, and Michael A. Ervolini, Managing Equity Portfolios, MIT Press, 2014.
Daniel Kahneman on the decision journal, as recounted by Michael Mauboussin on Farnam Street.
Bipsync, The Buy-Side Investment Research Process is Professionalizing, for the three-quarters figure, from its 2020 study with Greenwich Associates. Bipsync sells research-management software, so read it as a vendor's survey.
Essentia Analytics, Morningstar and Alpha Theory have no connection to Finn, and nothing here is their endorsement. They are cited because they are the evidence that scoring decisions against stated alternatives clears institutional scrutiny and peer review.