An agent system built for value investing.
Finn is a set of research agents that hold your positions and your thesis on each name, and draw on licensed market data. They work on schedules and on market events, and check every number against source before it reaches you. Over time they also score your decisions against the alternatives you were weighing.

The four layers around the model.
A general chat model waits to be asked, cannot see your positions, and cannot tell a real figure from an invented one. Four layers close that gap. Building them yourself means paying for market data, keeping connections and scheduled runs alive, writing your own checks, and storing memory so the agents still know your book next quarter. Finn comes with all four and keeps them running.
Validated data
Licensed market data, filings and transcripts, connected and paid for. Every figure in a report comes from these rather than from a model’s memory.
Autonomous agents
Six research agents that carry the recurring work. They start on a schedule, or when something happens on one of your names.
Verification layer
Automated checks on every citation and every table, plus a second model reading the draft against its sources. The same checks run whichever agent produced the report.
Long-term memory
One maintained file on your book: positions, watchlist, your thesis and KPIs on each name, and your standards. Every agent reads from it and writes back to it.
Each agent owns one recurring job.
All of them read from the same file on your book. Take the whole set, or add one to the process you already have.
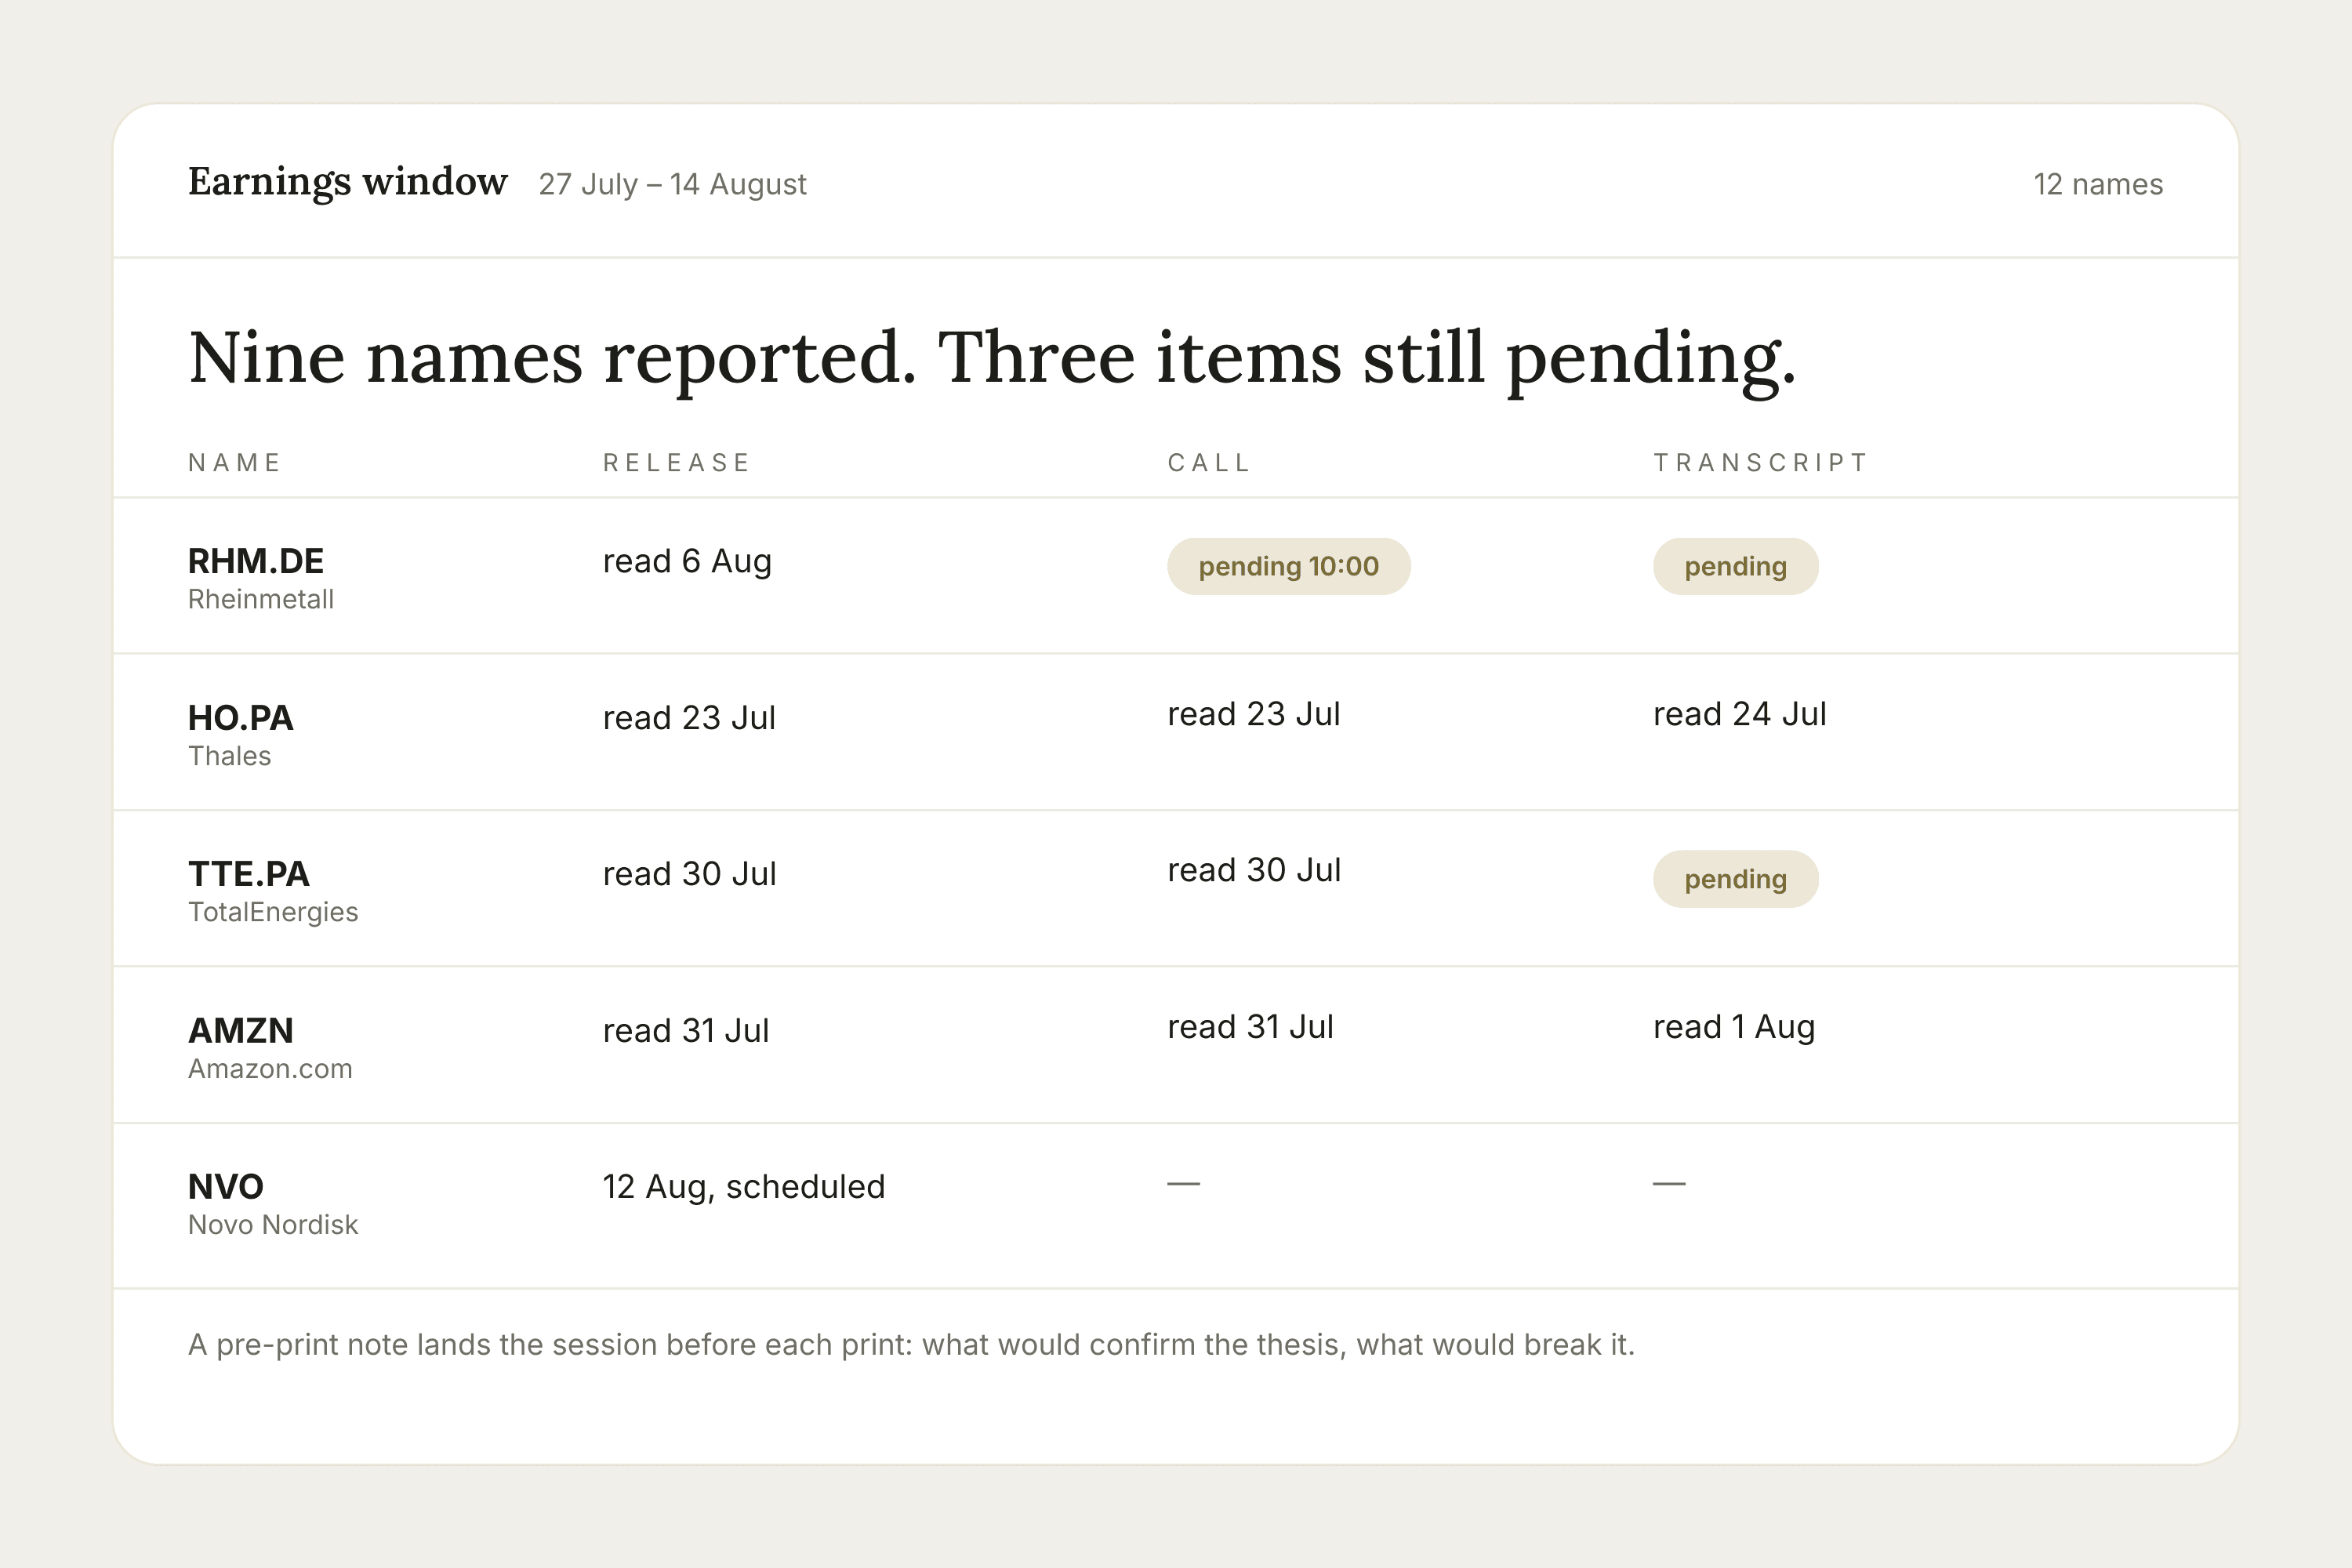
Every release, transcript and filing is read the day it lands, against the KPI history in your file. In reporting season a note arrives before each print: what would confirm your thesis, what would break it.
Release, call and transcript are tracked separately, so a pending call is reported as pending.
Research pipeline
Finn starts its own research when something fits your mandate, and takes your requests the rest of the time. You can see what stage every idea is at before the answer arrives.
An idea only reaches your watchlist if it clears the mandate you set.

Models and analysis
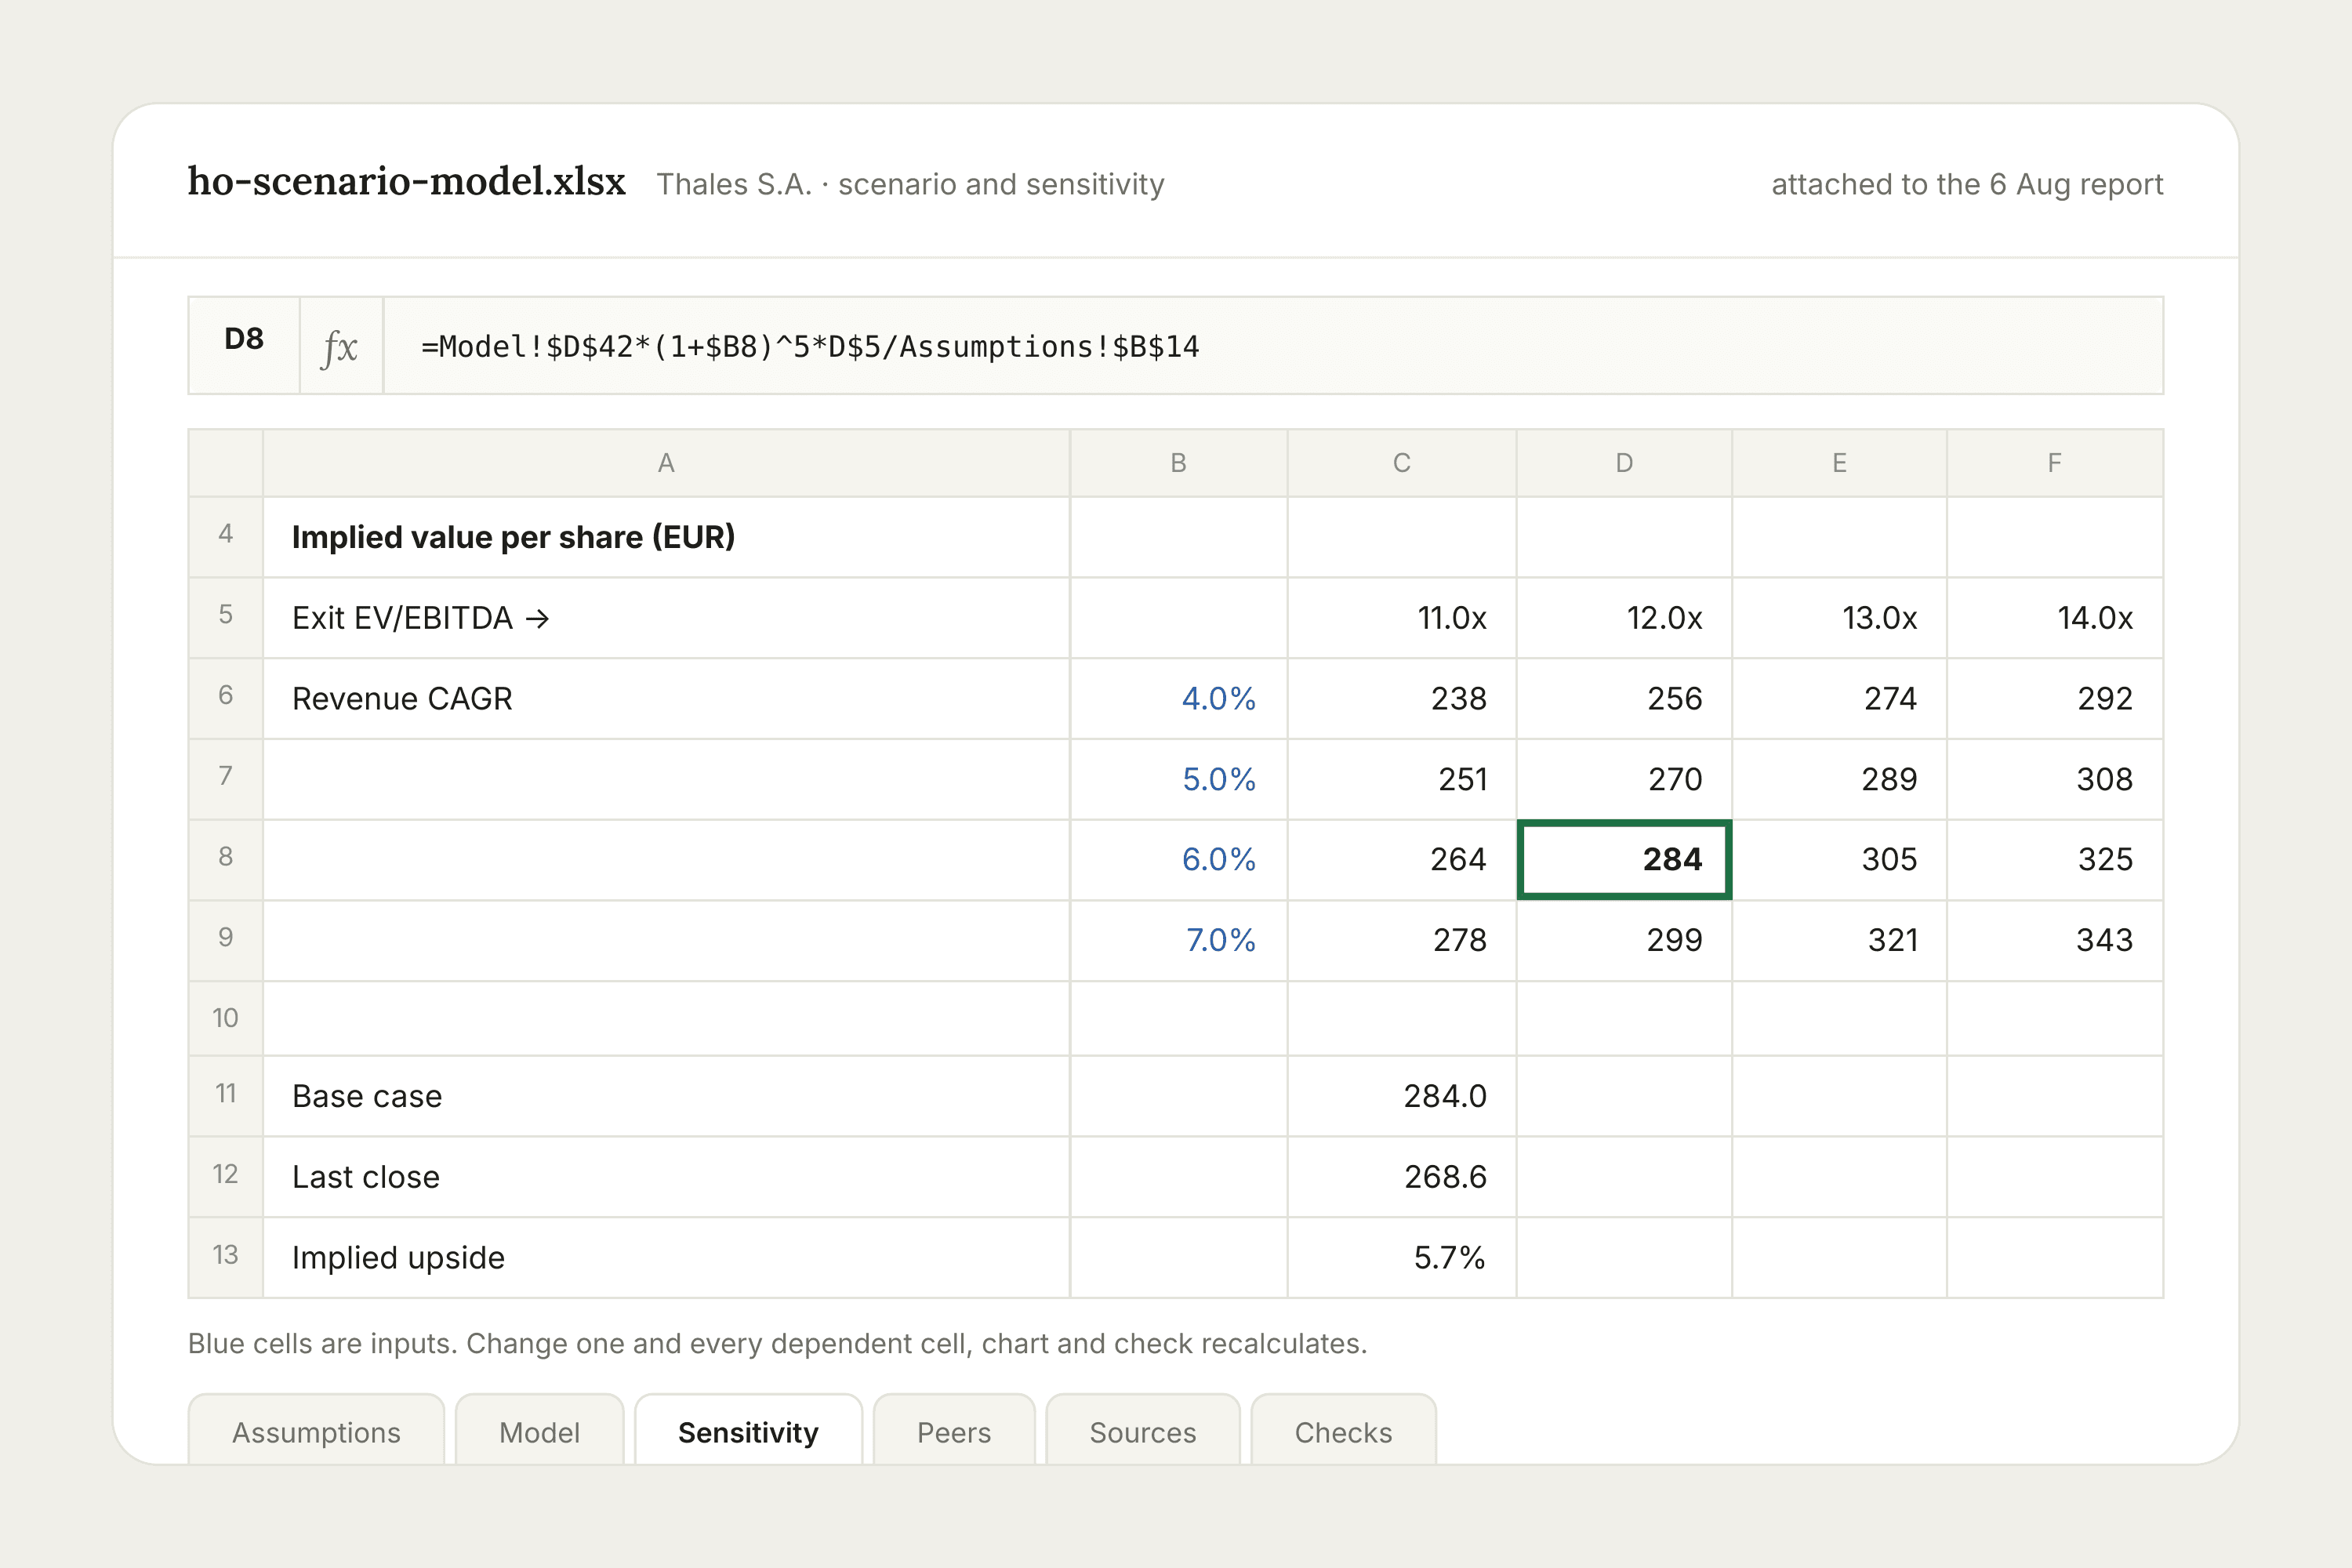
A scenario, sensitivity or peer comparison comes back as a report with the Excel workbook attached, live formulas intact, so you can change the assumptions yourself.
After the print, the workbook is updated and re-sent.
Morning brief
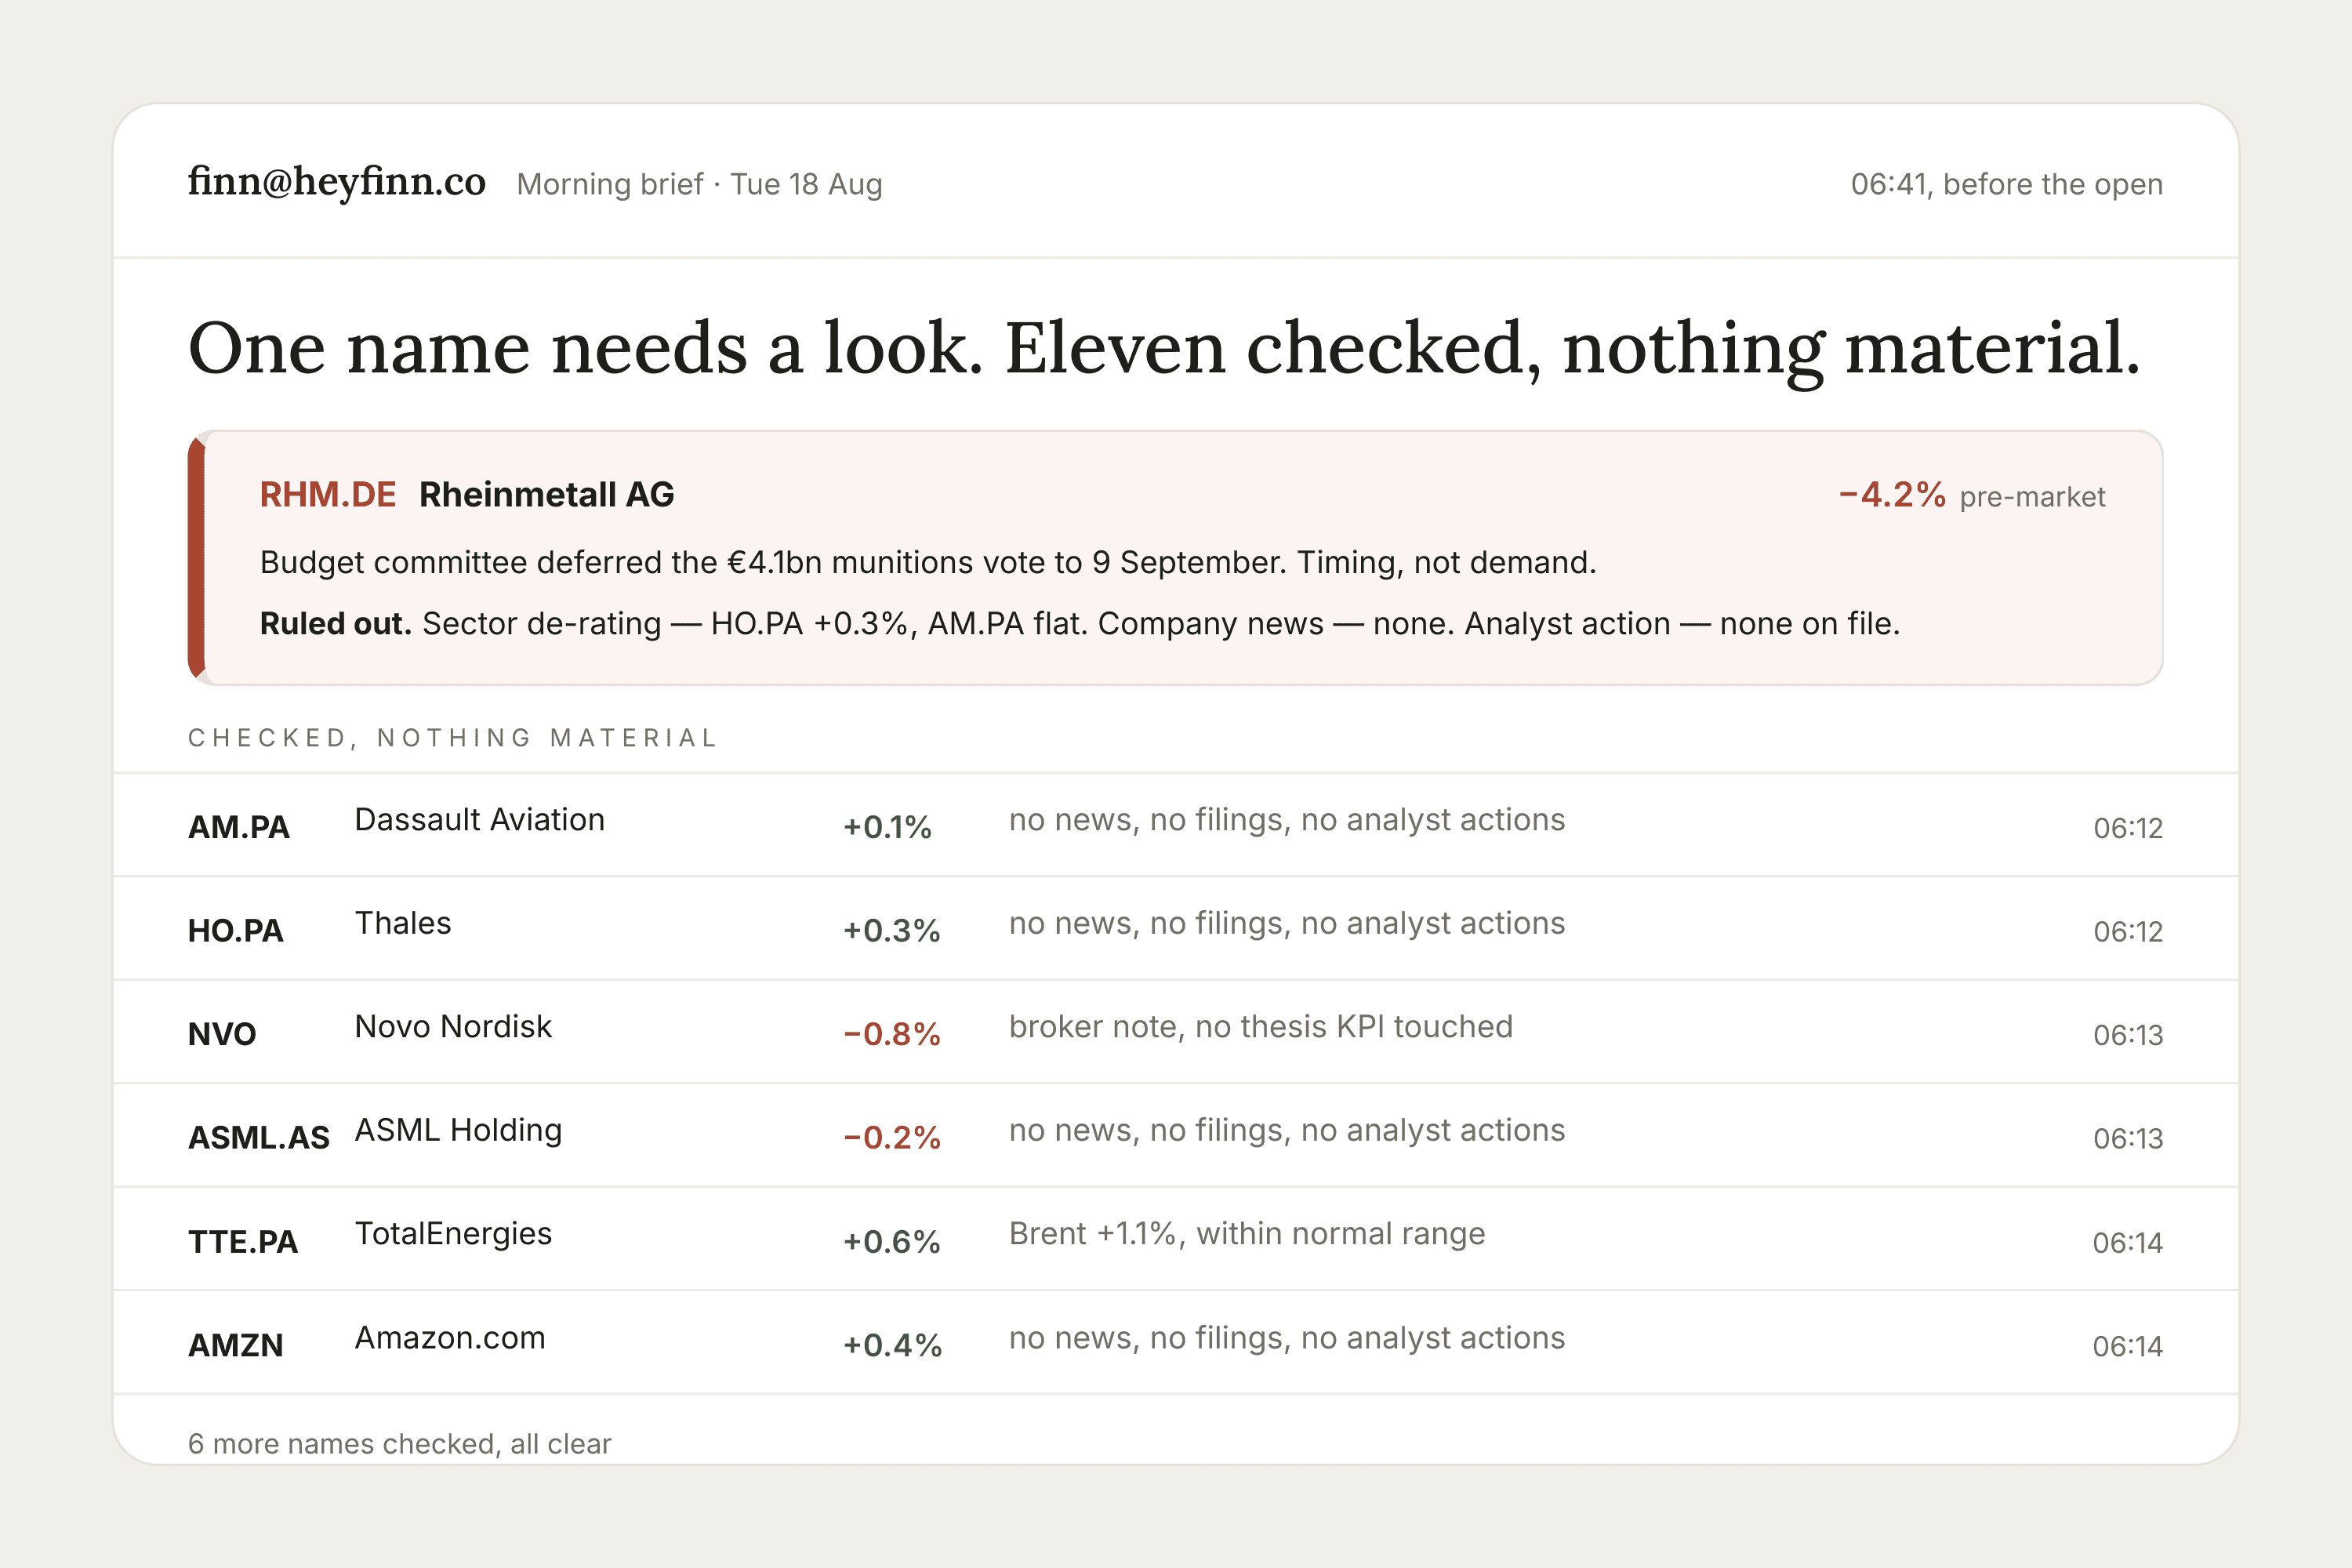
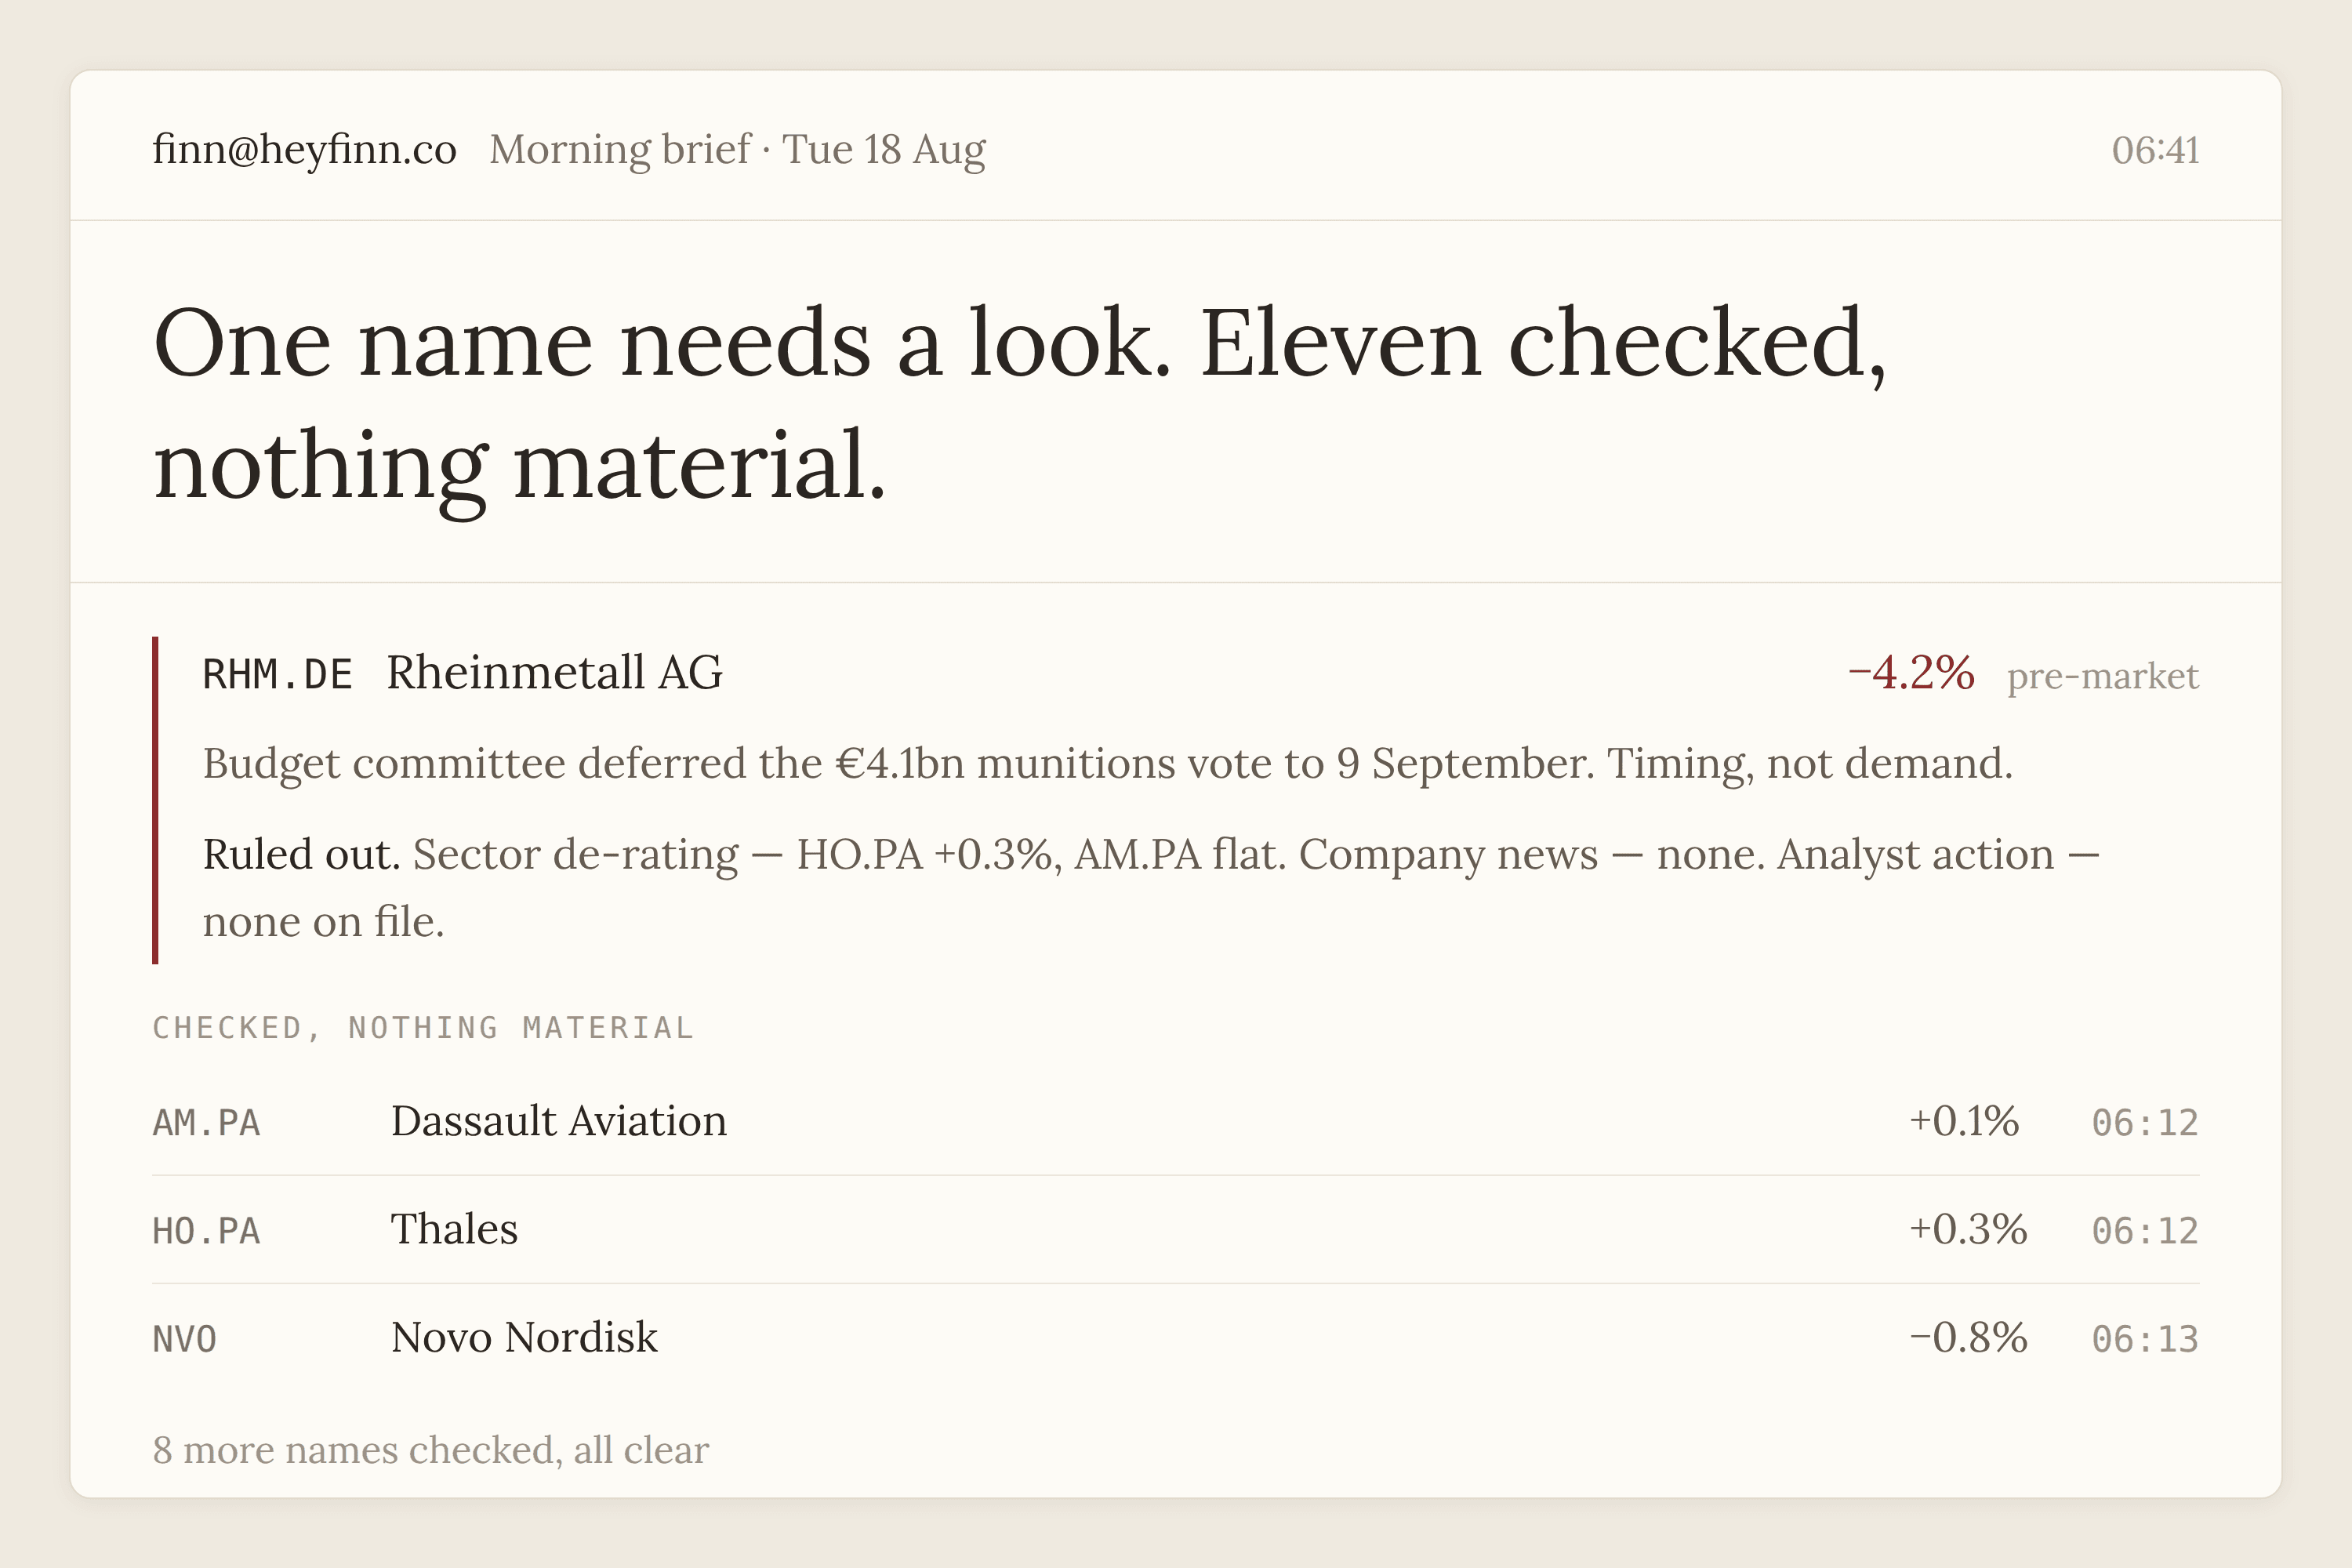
A brief lands before the open with what happened on your names overnight, read against your thesis. Names with nothing material get one line, so you can see they were checked.
Sharp moves get their own alert, including the explanations Finn ruled out.

Exposure and contribution
Attribution, factor exposures and contribution ranking come straight out of the file, with no data project first. Returns are split into local and currency across sector, region and country.
The sector call and the names you chose to express it are two different questions. This answers both.
Thesis tracking
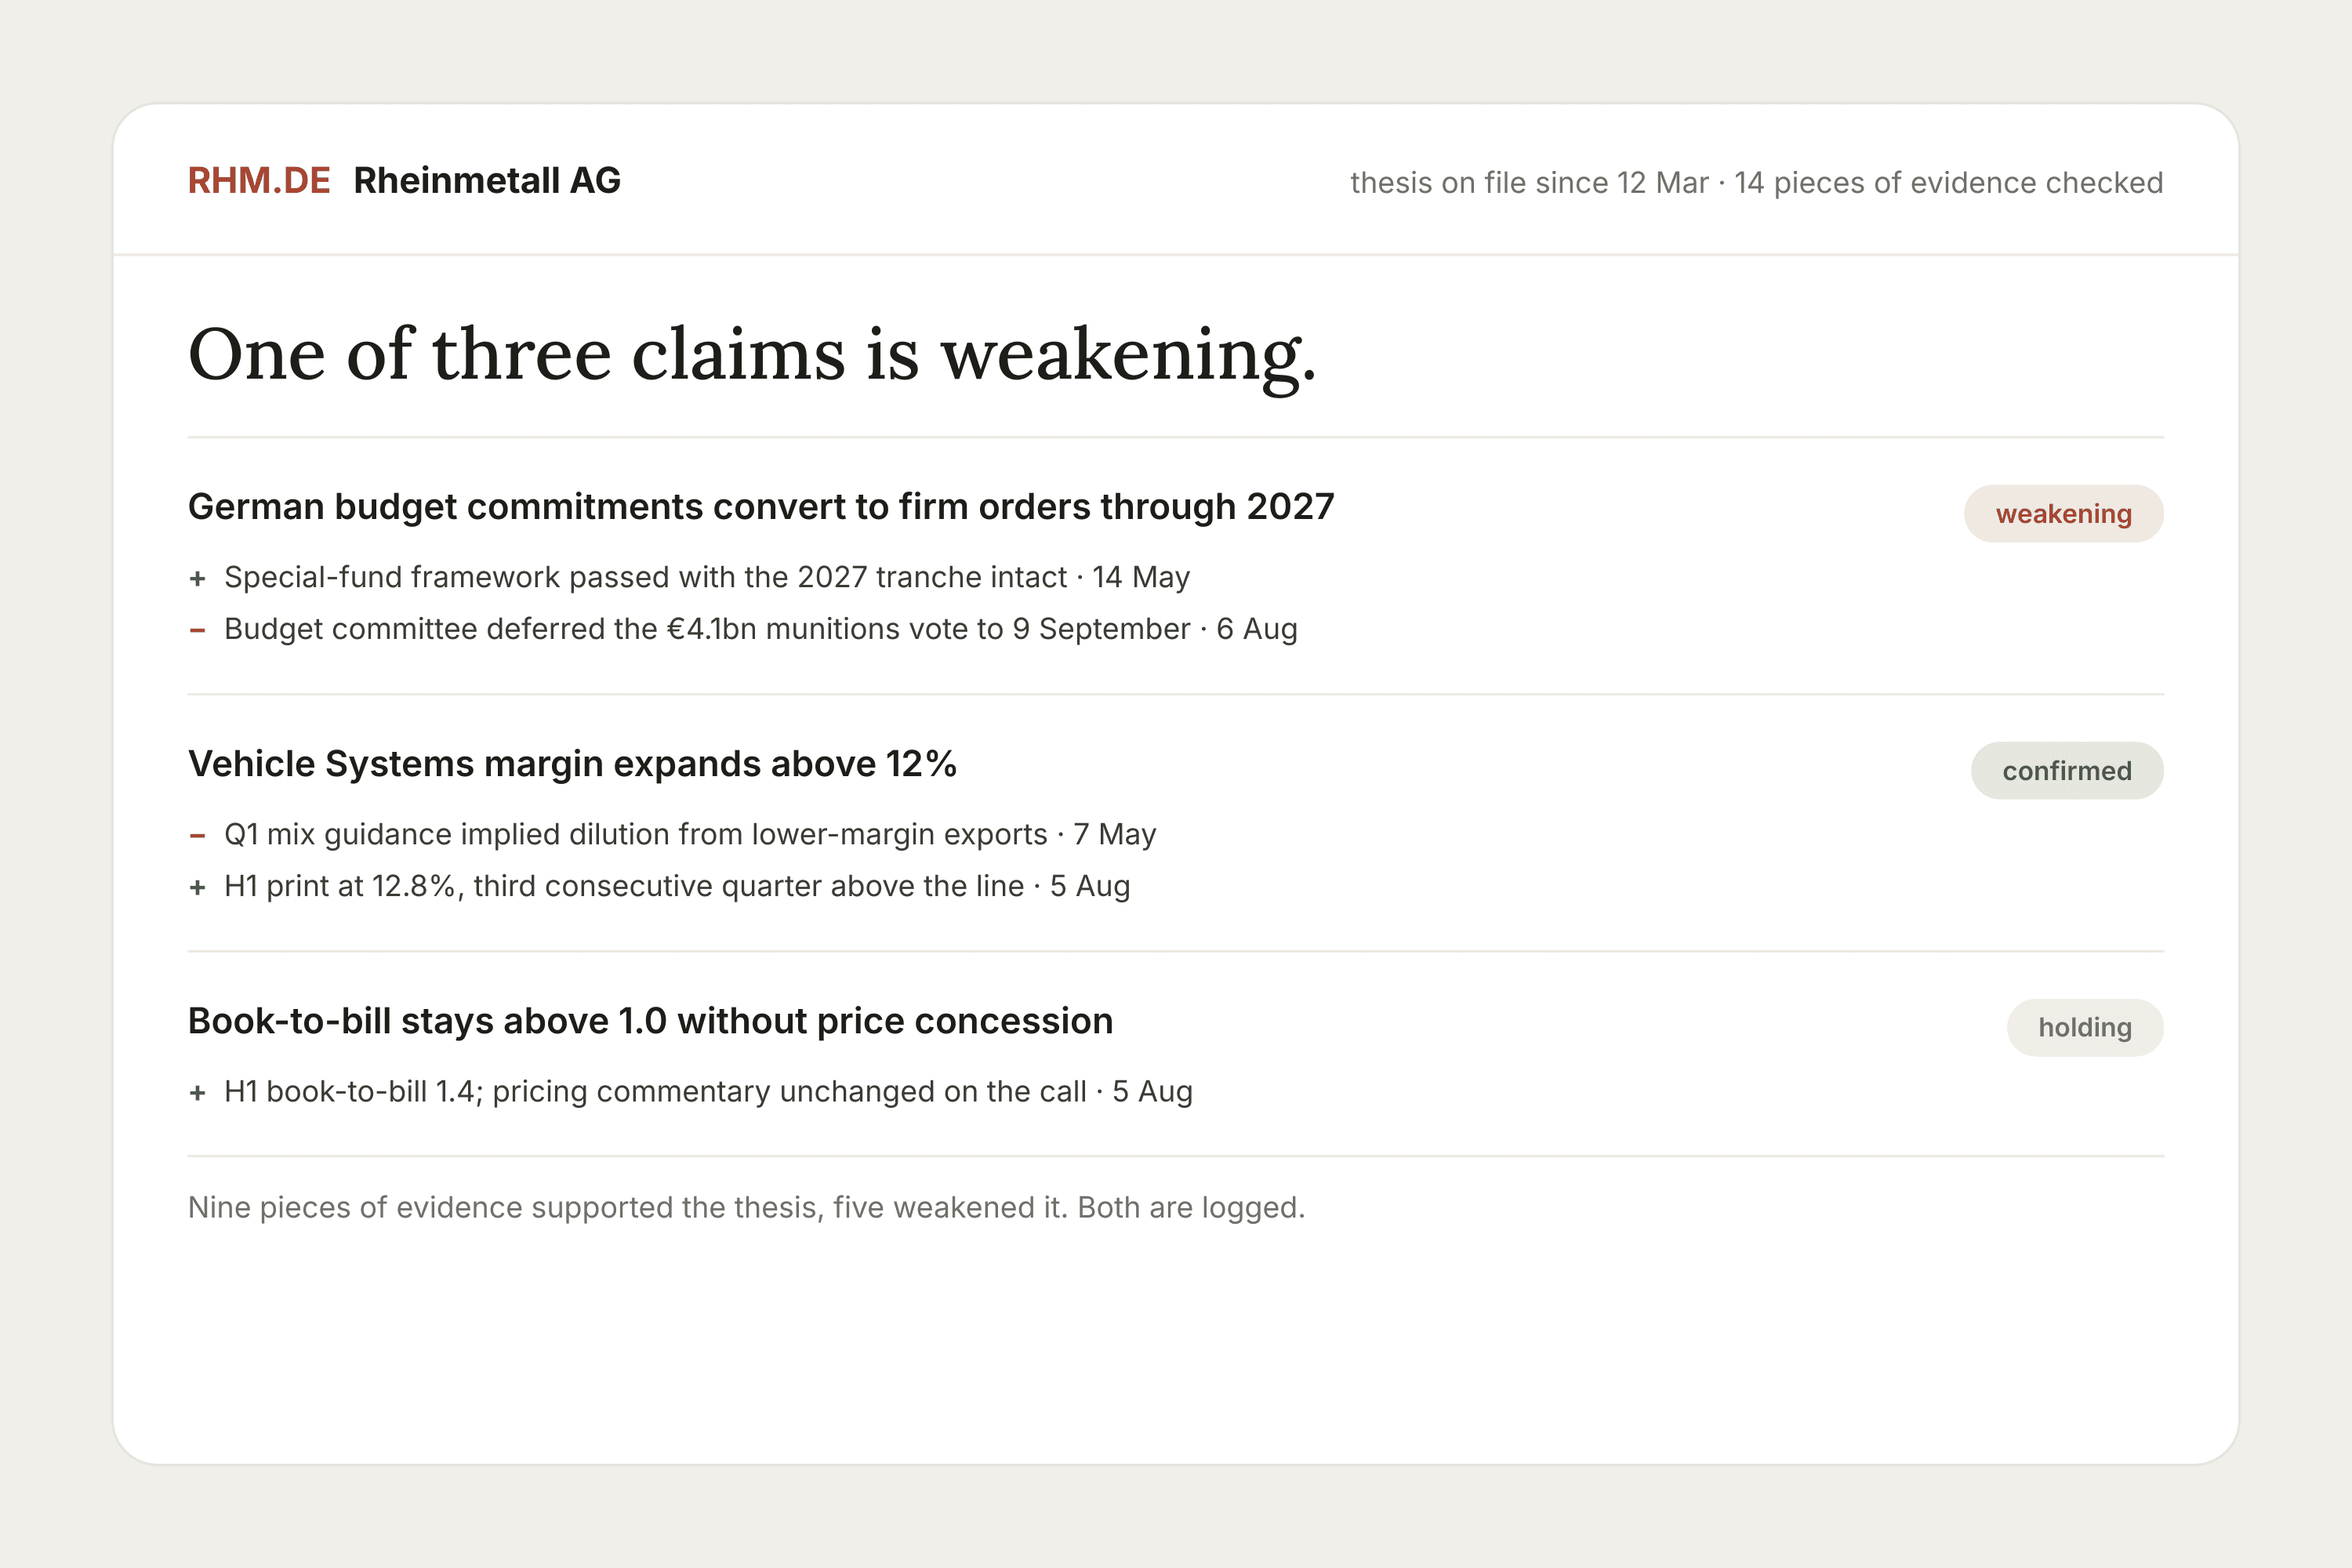
Your thesis becomes specific claims. New evidence is checked against them both ways, supporting and weakening.
You hear about a weakening case early, while your options are open.
See which of your own habits cost you money, in basis points.
Portfolio analytics tells you which positions made money. This tells you which of your decisions did.
Across 783 institutional portfolios. The leak is on the sell side, and it repeats.
Funds have been able to buy this analysis for over a decade and most still don’t run it, because scoring a decision needs your reasoning and the alternatives you were weighing at the time, and that lives in email and someone’s head.
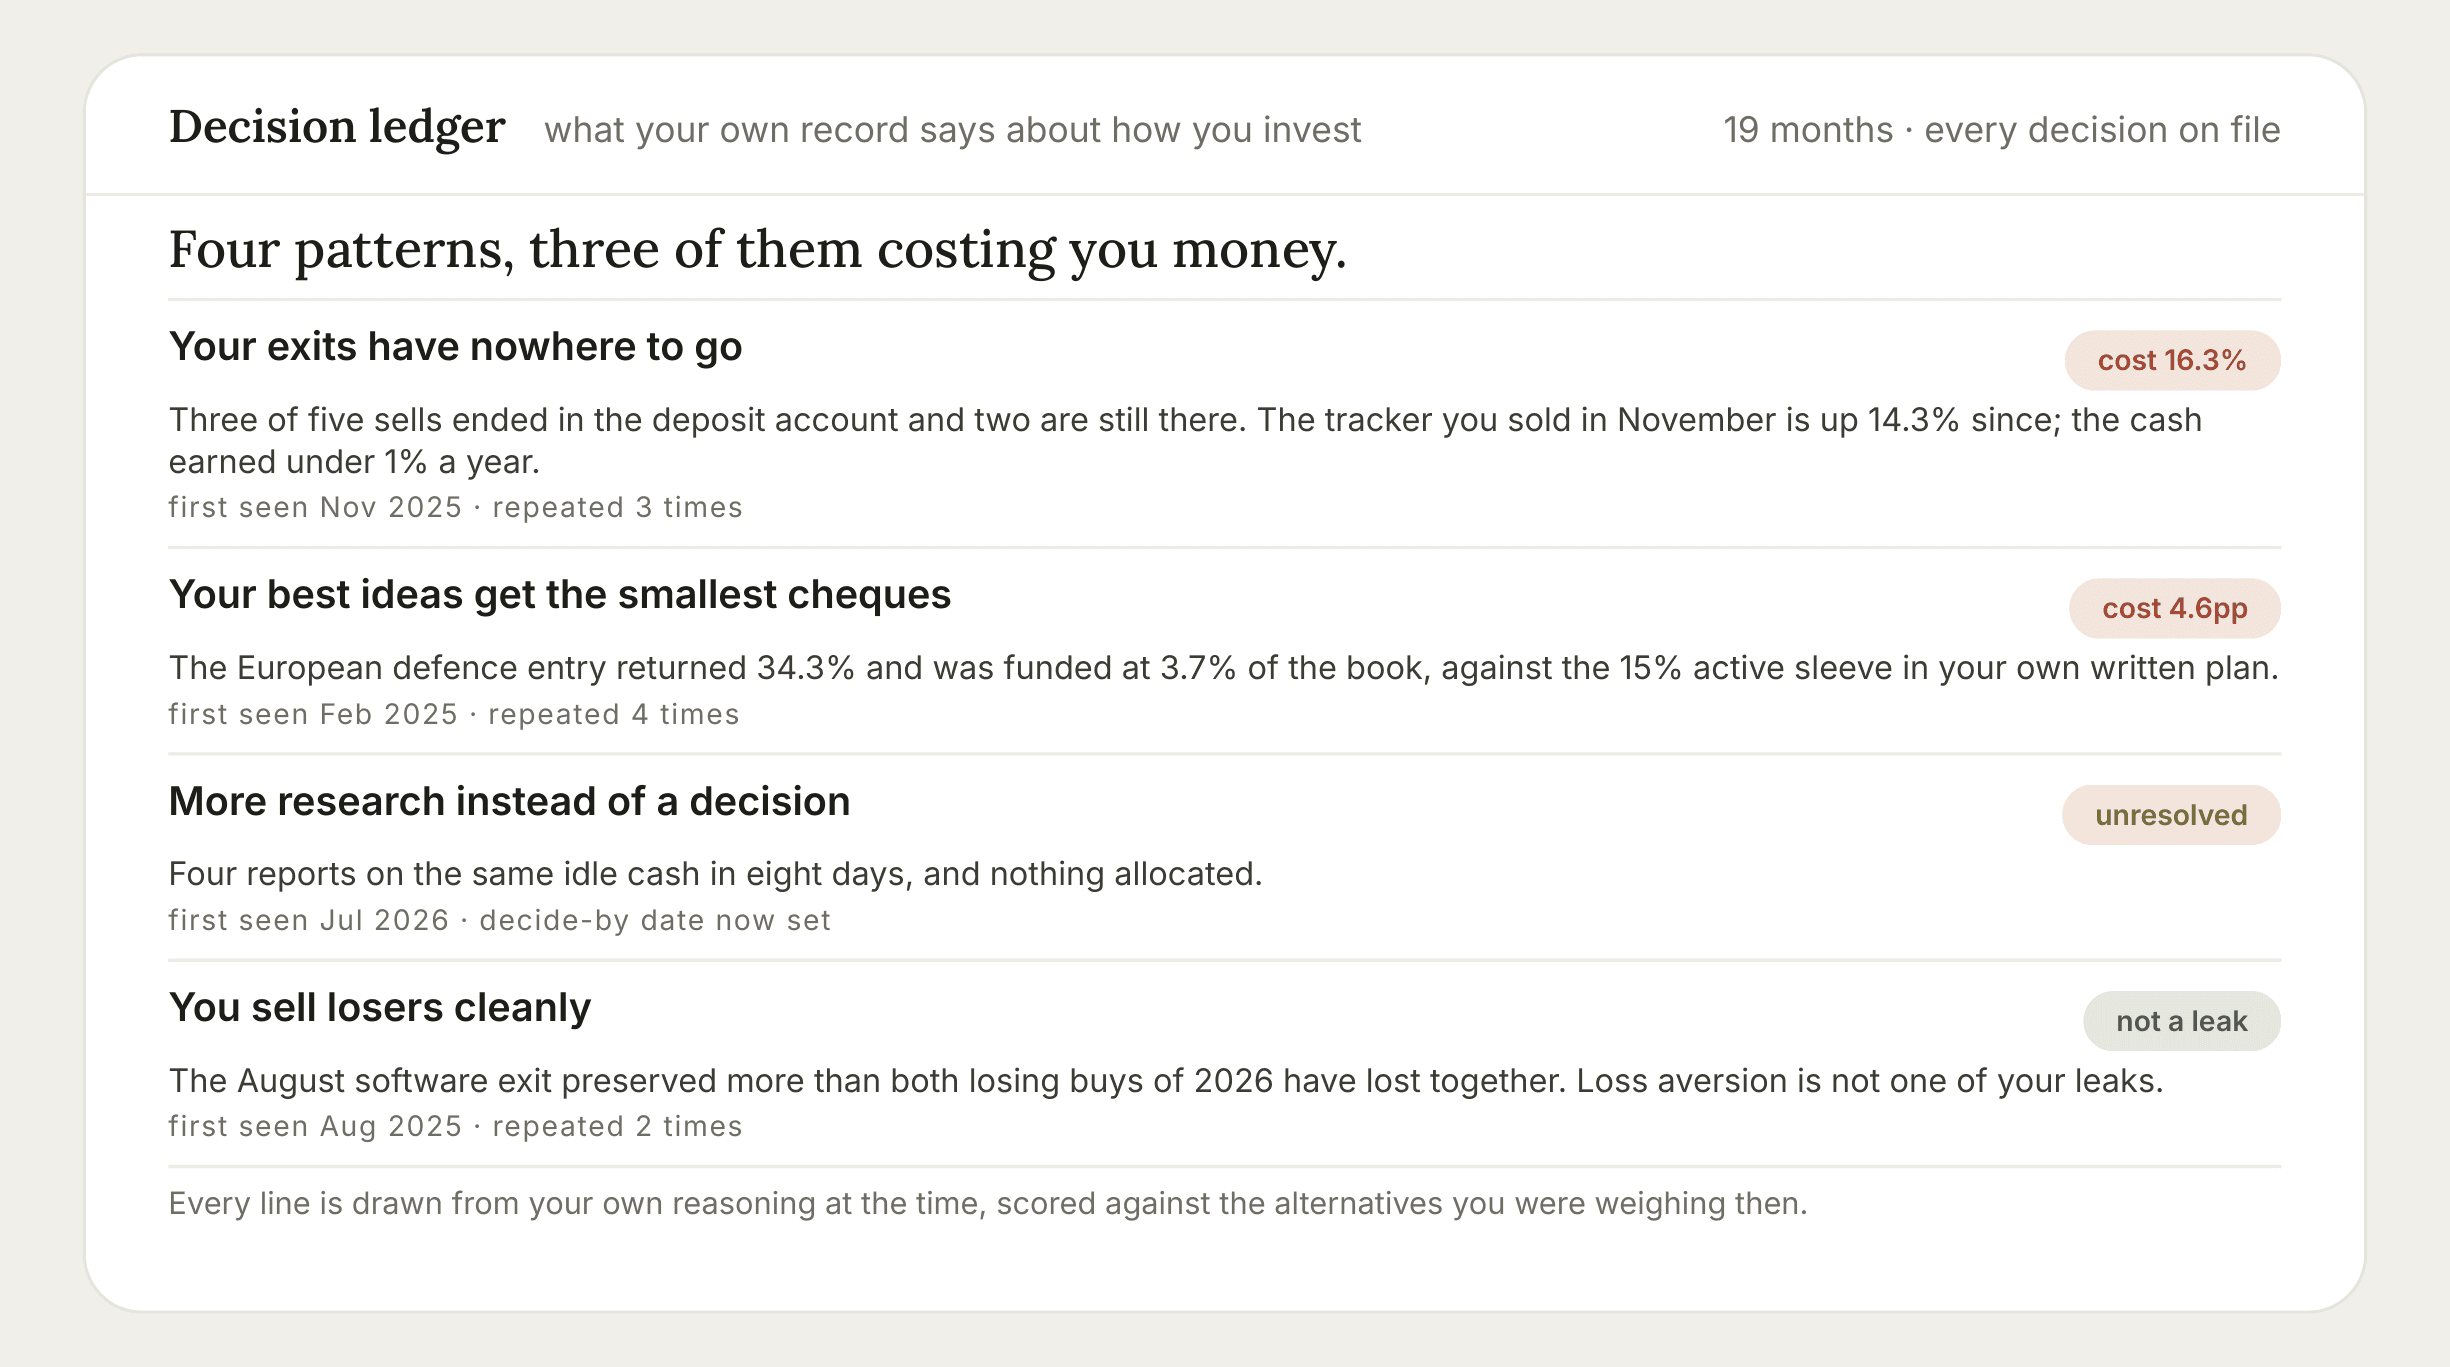
Nineteen months of one investor’s own record. Figures as published.
Finn saves every buy, sell, trim and pass with your reasoning at the time. After a few months that becomes a ledger of the patterns in your own decisions, each one priced.
The record cannot be backfilled. It only exists if your reasoning and the research shared one memory from the start.
What a normal week looks like.
Your inbox and calendar are the interface. The brief arrives before the open. A pre-print note lands midweek because a name reports Thursday. A broker note you forwarded comes back as two paragraphs with page references. A sensitivity you asked for on Friday arrives with its workbook. The monitoring runs whether you send anything or not.
Try Finn on your portfolio.
Get started with one email: your positions, your watchlist, and what you care about on each name. The agents start working the same day. Use the full functionality for free for two weeks, based on your actual portfolio.